
The US, along with most countries in the world, is currently in a rate hiking cycle that began in March 2022. Since the Fed began its rate hiking campaign, the response of the stock market has been surprising to many, myself included.
All financial assets are valued in virtually the same way: by calculating the present value of the earnings from the investment over some time horizon.
Therefore the two most important ingredients in the valuation of stocks and bonds are interest rates and time. The higher the interest rate is right now, the lower the value of an interest payment or dividend 5 years from now will be.
Rising interest rates, then, should be bad for stock prices. If the earnings potential of the companies in the Dow Jones index stays the same, but the interest rate by which we are discounting those earnings goes up, then the price should go down. The stock market behaved this way for about 7 months after the Fed’s first hike in 2022. Then, it didn’t. But what I want to share with you is that this is actually… sort of normal. Actually, it may be more accurate to say there is no “normal”.
I looked at all 20 rate hiking cycles since the founding of the Fed, and plotted how the Dow Jones performs in the 36 months after the first hike. The first cycle in the sample began in December 1917 and the most recent began in March 2022.
This chart shows the excess return of $100 invested in the stock market at the start of a rising rate environment. What do I mean by excess? It’s the excess return over a low-risk, short-term investment like a money market fund. Example: right now the excess return on $100 invested back in March 2022 is 62 cents. So after two years, stocks have gotten you only 62 cents more than you would have if you’d put the same $100 in a money market fund.
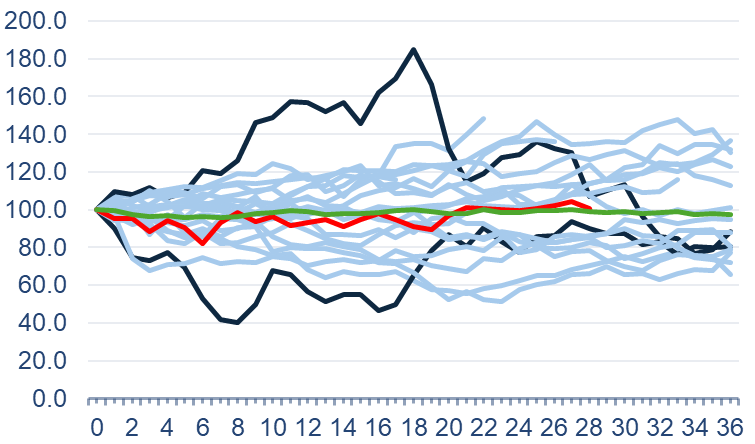
Dark top line: cycle beginning February 1928, Green line: average of all 20, Red line: this cycle (beginning 2022), Dark bottom line: cycle beginning 1931.
The next thing to point out is that this cycle (red line) is practically hugging the average (green line). This market is normal, almost frustratingly normal. We started below average and now we’re almost exactly average. What conclusions can investors draw from this?
The average value of $100 invested in the stock market at the start of a rate hiking cycle (green line) is about $97. That means on average, you’ll end up with $3 less than you would have if you invested in the money market fund when the hikes began.
But these returns are almost evenly disbursed: nine cycles result in gains of at least 10 percent, and eleven result in zero gains or losses. We can calculate an average, but that average is nothing close to a “norm”. There’s a slightly greater chance of loss, but not much.
The early or mid-career investor can handle that uncertainty. However, if I’m in the last decade of funding my retirement (55-65), I’m more likely to take the gift of high interest rates with little risk, and park the stock portion of my account in the money market fund.
The broader point here is that there’s a big assumption out there in the markets, and the financial media, that asset prices are much more responsive to what the Fed does than they actually are. There is no “normal” stock market response to higher rates. Thus, the factors on which we decide to invest our liquid assets shouldn’t change from cycle to cycle. The first two questions are always the same: how much risk can I afford to take given where I am in life? And, is the stock market paying me for taking risk?