
Summary
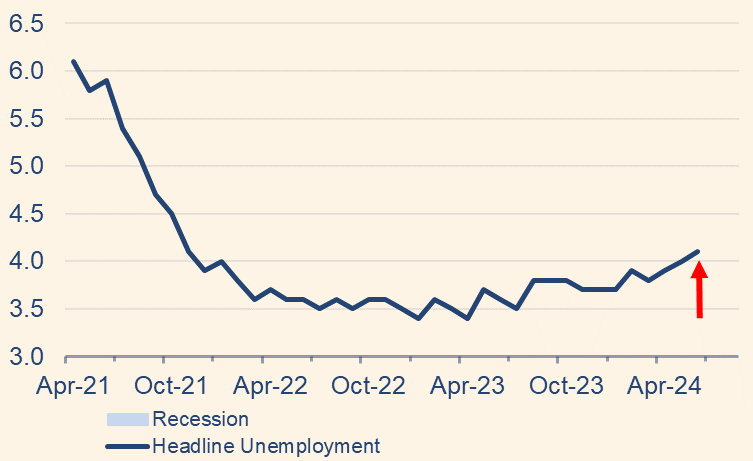
- US Business Cycle . The US job market is cracking. The unemployment rate is 0.7 percent higher than its cycle low of 3.4 percent, reached April of 2023, it was 3.5 a year ago. That means we’re past the “Sahm Rule” trip-wire. Additionally, unemployment benefit claims have been back on the rise for the last two months. If the typical historical pattern plays out, the unemployment rate – 4.1 as of June – will reach 5 between September and November.
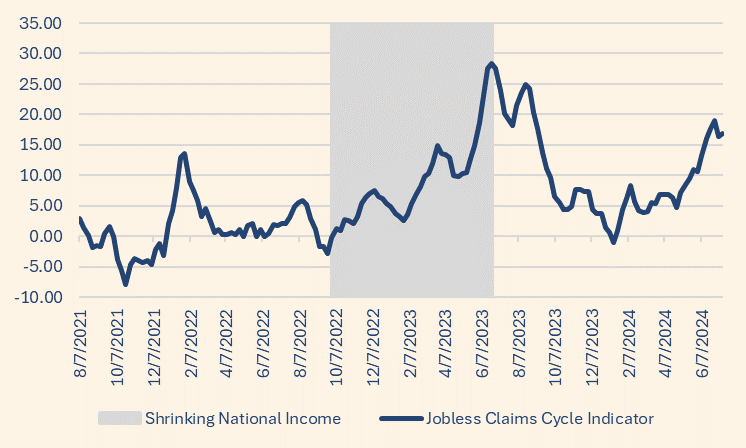
- Other indicators, shown below, track the slowdown in economic activity. The US is likely to be in Recession by the 4th quarter, but based on job market trends, may be in one already.
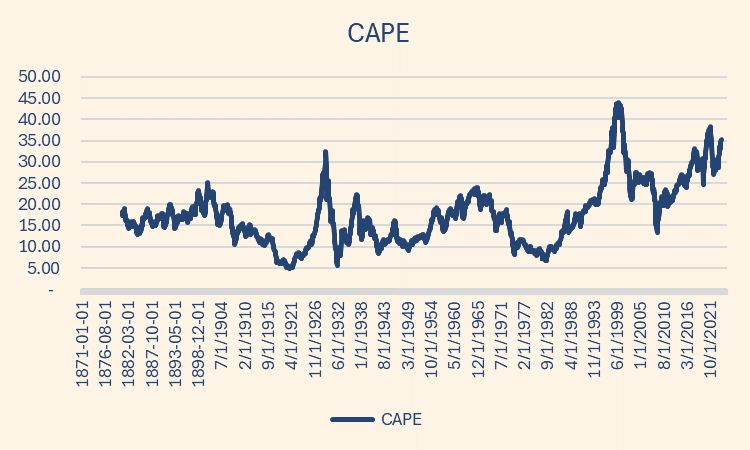
- Stock Market. Stocks are at a high water mark in terms of valuation relative to history. The only time the long-term price to earnings ratio has been this high – 35 – was 1999. It’s also highly concentrated: through June 30th, the Mag 7 stocks accounted for 61% of the returns to the S&P500 stock index. This doesn’t necessarily mean a crash is imminent. If this were a replay of 1999, stocks could continue to appreciate for another full year. What these indicators do mean is that share prices are extremely vulnerable to any kind of remotely bad news. The S&P500 dropped more than 2 percent on the day this was written because of bad earnings from Alphabet and Tesla. There are 164 liquid stocks outperforming the market with an average excess return of
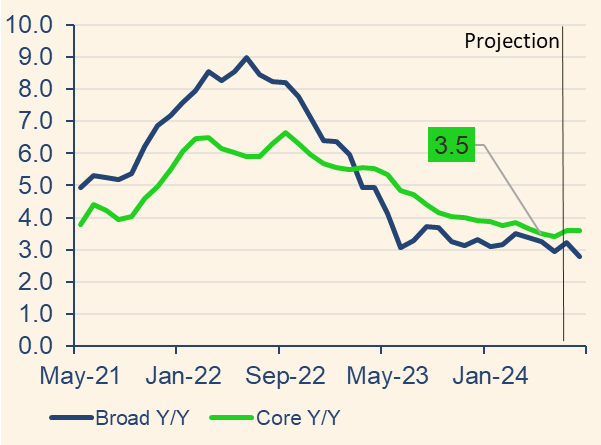
- Inflation. There has been deflationary pressure in the economy for the last couple of years. The major inflationary pressure was the huge monetary and fiscal stimulus from May 2020 to March 2021. But since the tail end of those inflationary forces, the private economy has been deleveraging. Which is to say the amount of credit outstanding is shrinking relative to the economy. That said, we may very well have seen the bottom of this inflation cycle. The annual broad inflation rate for June was 2.9 percent, just over half a percent less than the post-war average. Don’t expect prices or interest rates to drop significantly.
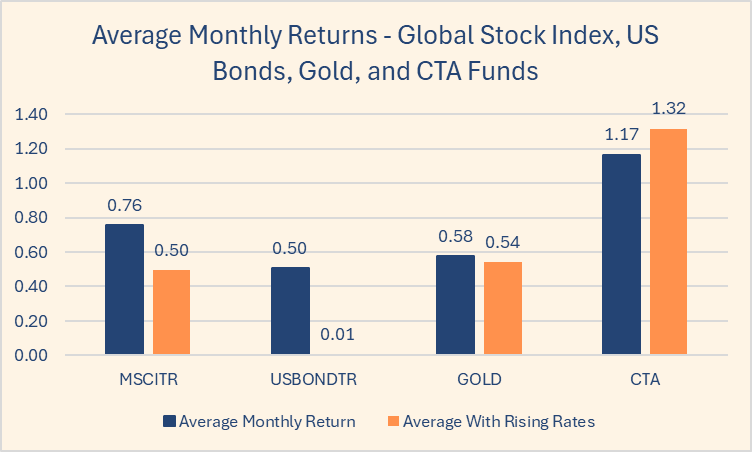
- Investments. The average American has 70 percent of their financial assets in stocks and 30 percent in bonds. Neither of these asset classes play well with instability, rising interest rates, or inflation. One way to think about a portfolio is to set it up such that half the assets do well in one regime – the things are stable and decent regime, and the other half does well in the instable economic regime. One way you might do that is to cut your stock/bond exposure in half, to 35/15, then divide the rest up between gold and a CTA fund. Both of these asset classes do well when stocks perform poorly. Both do well in high interest rate environments. A good benchmark for allocation is 20 percent gold and 30 percent CTA. The realities of 401(k) matches and retirement plan contribution limits may make those allocations impossible to replicate to the digit, but investors will still benefit from diversification by getting close.
Rates Review
The US 10-year Treasury yield has dropped by half a percent since April, which has driven most of the fall in mortgage rates.
| US 10-year Treasury | 4.28 |
| 30-year Fixed Rate Mortgage | 6.77 |
| 10y-mtg spread | 2.49 |
| Fed Repo, Fed Funds | 5.30 ; 5.33 |
| 3-month Treasury Bill | 5.314 |
| Money Market Savings | 0.66 |
US Business Cycle
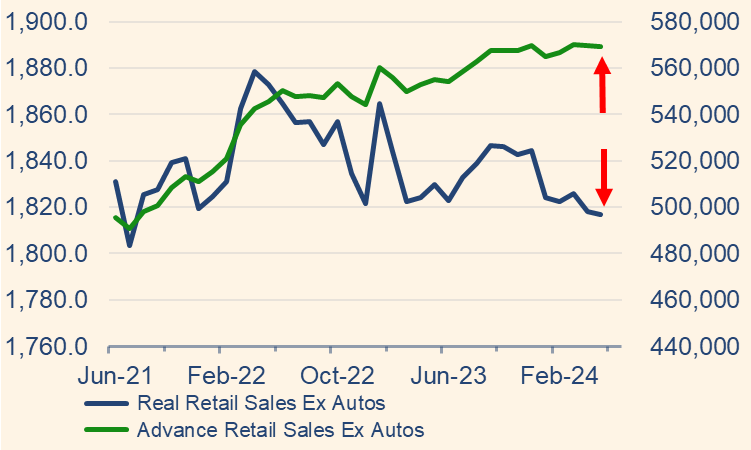
Unemployment is rising, real retail sales haven’t seen a new high since December 2023, and Real National Income per capita hasn’t seen a new high since 2022.
Headline Unemployment Rate, Previous 3 Years
Unemployment Claims Cycle Indicator, Past 3 years
Nominal and Real Retail Sales Excluding Autos
Inflation
US Broad and Core Annual CPI Inflation Rates, past 3 years
Deflationary Pressure from Deleveraging
Asset Class Diversification
Average Monthly Returns since 1973 – Global Stocks, US Bonds, Gold, and CTA Funds
Stock Market
The stock market is running hot and share price returns are highly concentrated. These factors do not guarantee a crash, but they do make share prices vulnerable to even a small pin-prick of bad news.
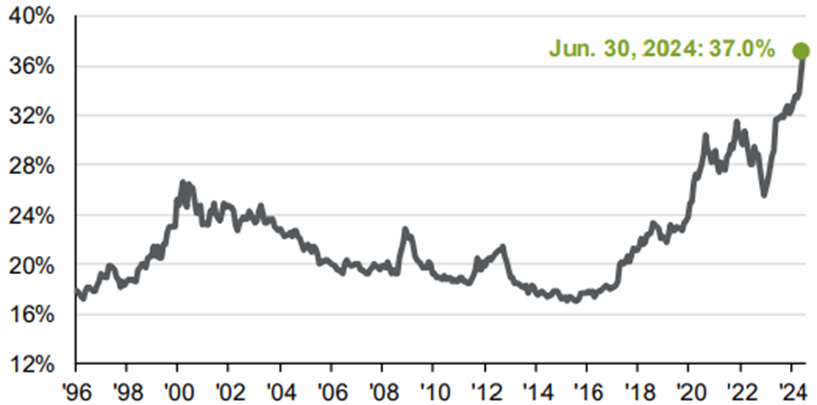
The top 10 stocks – 7 of which being concentrated in the technology sector – now make up 37% of the S&P500. This is the benchmark index for most investors’ stock holdings.
Concentration – Weight of the top 10 stocks in the S&P500, by Market Capitalization
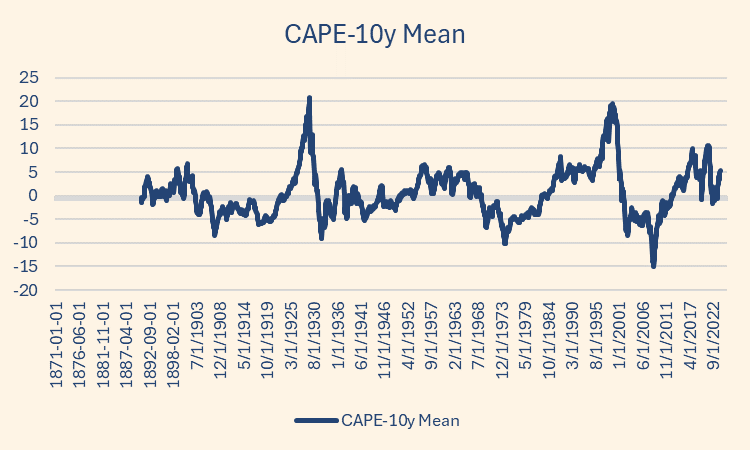
The Shiller Price-Earnings Ratio has the market at one of a handful of all-time-highs in terms of valuations. If one buys a share of an S&P500 based fund today, he or she is paying $35 per $1 of 10-year average earnings.
Cyclically Adjusted Price to Earnings Ratio (“Shiller” Ratio)
However, stocks are just more expensive now. There’s been a huge shift in the earnings multiple since 1990. So, perhaps it’s more appropriate to compare the Shiller Ratio to its 10-year average. On that measure, the broad stock market could – and I mean could – continue to appreciate another
Shiller Ratio – Deviation from 10 year Average