
Earlier this week, a prominent finance and macroeconomics educator – George Gammon – posted a video in which he suggested a different way of defining whether or not the economy is in recession.
Here's The Real Recession Indicator They Don't Want You To See https://t.co/SNqoJsRH64
— George Gammon (@GeorgeGammon) April 29, 2024
It can be summarized in two words, “purchasing power”. If the purchasing power of the general population is increasing, the economy is expanding. If it’s decreasing, the economy is contracting.
The National Bureau of Economic Research is recognized as the academic body that gets to define the beginnings and ends of recessions. According to their website, they reference a set of indicators and use some discretion when determining if the economy is in an expansion or in a recession. Specifically, these:
- Inflation-adjusted personal income less transfers (in other words, just income from work)
- Nonfarm payroll employment
- Real personal consumption expenditures
- Wholesale to retail sales adjusted for inflation
- Industrial production
This process really should be simpler. Simple enough that it doesn’t take a council of PhD economists to make the determination. This would be better for the economists on the Business Cycle Dating Committee as well; their skillset would be better utilized elsewhere.
Gammon’s idea of using purchasing power would button this up into a single rule. I decided to try and figure out what the historical business cycle dates would look like if we followed a process like this.
The first question is – what data points that already exist are the best way to measure purchasing power? A lot of folks would, for good reason, look at average or median wages and adjust them for inflation. Real wages rising – expansion. Real wages falling – recession.
This is a logical approach, but not quite comprehensive enough, because it doesn’t account for business income. Imagine a scenario in which the supply of labor is tight enough that businesses are raising wages faster than inflation. That would make the inflation adjusted wage look good, but what if businesses are sacrificing investment spending to cope with high inflation and low labor supply? Then we’re borrowing from future growth to satisfy current consumption, which does not reflect a healthy economy.
I landed on Real (aka inflation-adjusted) Gross National Income Per Capita. Gross National Income (GNI) is, well, exactly what it sounds like: the sum total of income accruing to the households and businesses in the nation. If inflation-adjusted wages are rising because labor is getting more productive, Real GNI will rise. If businesses and households are spending more, even after adjusting for inflation, but they’re doing so by sacrificing investment, Real GNI will go down. If businesses are keeping people employed, but cutting hours or converting workers to part time, the Real GNI will fall. If businesses are increasing profits, but doing so by cutting hours or reducing investment, Real GNI will fall.
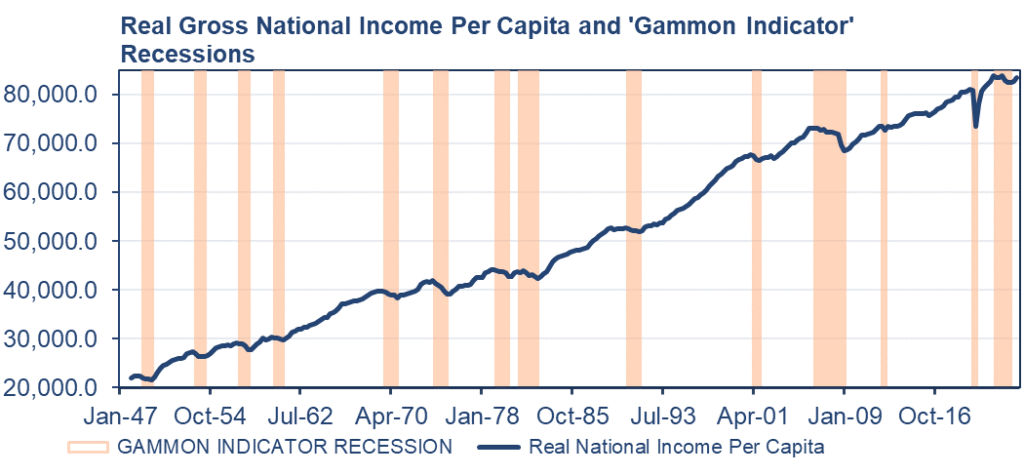
With that, here’s what the business cycle dates for the last 76 years would look like if we defined a recession as two or more quarters of declining inflation-adjusted national income per capita.
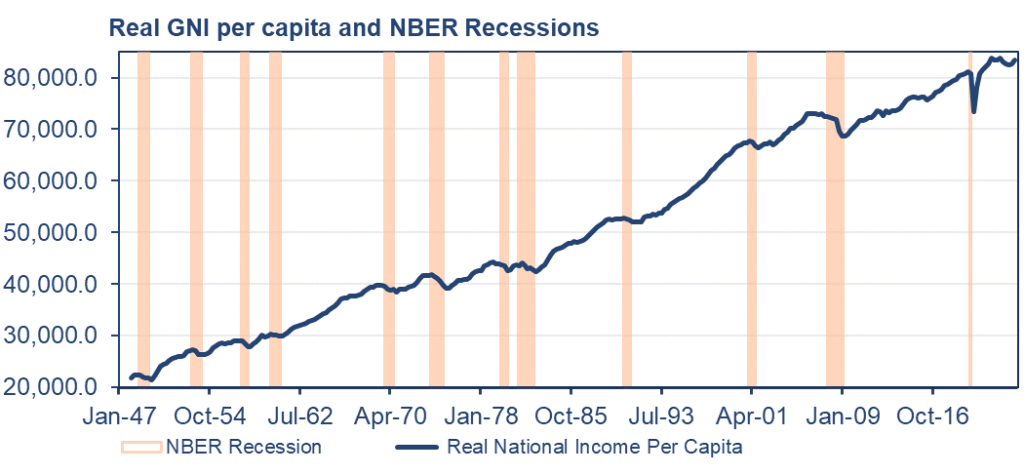
And here is the generally accepted official series for comparison.
The Gammon Indicator adds two more recessions to the history: two quarters in the middle of 2012 and six quarters beginning in January 2022.
Through the lens of this indicator, the economy came out of recession in the third quarter of 2023, but has yet to recover and is primed to dip again a la 1981. Overall, it lengthens just about every recession by at least one quarter, because population-adjusted income tends to go down before Gross Domestic Product (GDP) does.
I also think an important indicator of the health of the economy is how long the recovery takes. National Income didn’t decline throughout the entire Great Depression. There were 4 years of decline from 1929 to 1933, four years of growth, and then another two years of decline starting in 1937. Were the years in between the declines particularly good? No, of course not, hence “Great Depression”.
Recovery is how long it takes to get back to where the economy started before the recession. From my limited personal experience, this is also how long it takes for people to start feeling “good” about the economy again.
The blue shaded areas indicate when Real National Income Per Capita is growing but has not yet reached the pre-recession high. We might call this period the “recovery”.
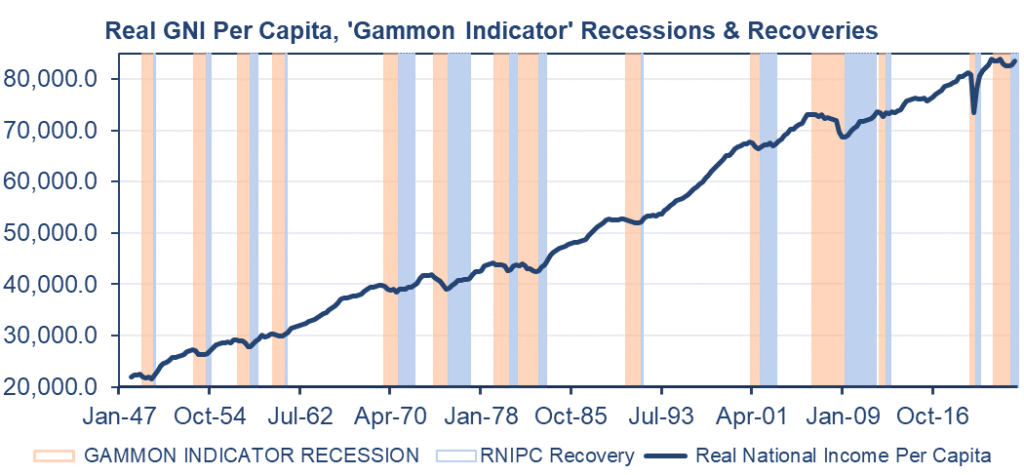
When accounting for declines in Real GNI per capita, and how long the economic recoveries take, it really visualizes just how bad the “Great Inflation” of the 1970s was. Jim Rickards referred to this period as an “inflationary depression” and I think that’s an accurate characterization. It also better describes how bad the “Great Recession” was. The conventional dating would call this an 18 month recession followed by 11 years of uninterrupted expansion. This convention reflects more accurately what most people felt about it at the time: that the economy was in the toilet for seven straight years. It also seems to better reflect sentiment in this cycle, as the economy hasn’t seen a new high since December 2021.