
Summary
Last month I compared the Federal Reserve Board’s outlook for rates against what the Futures Markets have “priced in”. I also covered global systemic risks along with changes particular to the US Economy:
- Global Risk: China’s real estate meltdown and banking system issues
- US Economy: weak holiday hiring, slowing inflation, unemployment
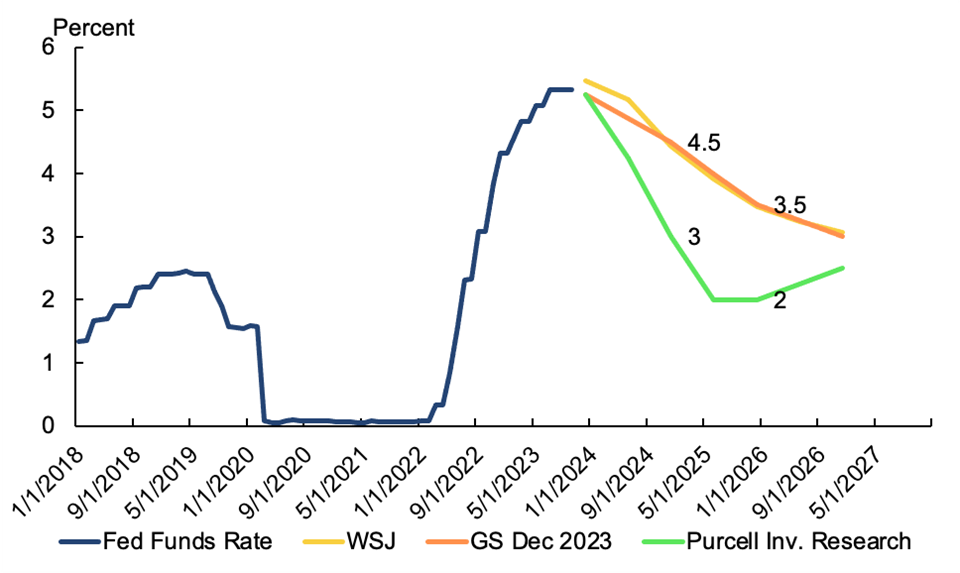
My outlook under a no-recession scenario was for the Fed Funds rate to reach 4 percent by the end of 2025, and to get as low as 2 percent in the case of a recession. While a slight majority of Economic Forecasters (52 percent) now see a soft landing (no recession), I still maintain a recession as the base case going into 2024. This wouldn’t be the first time that the consensus among experts turned out to be wrong.
With virtually no change in economic or financial conditions since November, my outlook hasn’t changed. Here’s how it compares to the Wall Street Journal’s Survey of Economic Forecasters and the outlook from Goldman Sachs. Forecasters at Goldman have also put themselves in the “soft landing” camp, and in mid-November published research entitled “US on its final descent into a soft landing”. Both outlooks have the Fed Funds rate reaching 3 ½ percent by the end of 2025. I see Fed Funds reaching 2 by the same period, with “steeper” cuts as the recession takes shape in 2024.
Chart A: Fed Funds Rate Forecast from the Wall Street Journal, Goldman Sachs, and Purcell Investment Research
This report has updates to the Federal Reserve’s rate projections and to what the Futures markets are pricing in for 2024 and beyond. There’s been virtually no change in the former and significant changes in the latter. For more background on the economic and financial conditions that are shaping my outlook, continue reading at the section titled “U.S. Economy”.
First off, the Federal Reserve Board’s projections. The Federal Reserve’s Open Market Committee held its December meeting on the 13th and left the rates unchanged[1]. It’s now been five months since the last rate hike in July, which was to a 5.25 percent. Every quarter the Fed releases a Summary of Economic Projections. The projected path of rates hardly changed from last quarter to this one. That didn’t stop the media from calling this meeting a “pivot”[2].
Chart B: Federal Reserve Projections for the Fed funds rate in September and December 2023
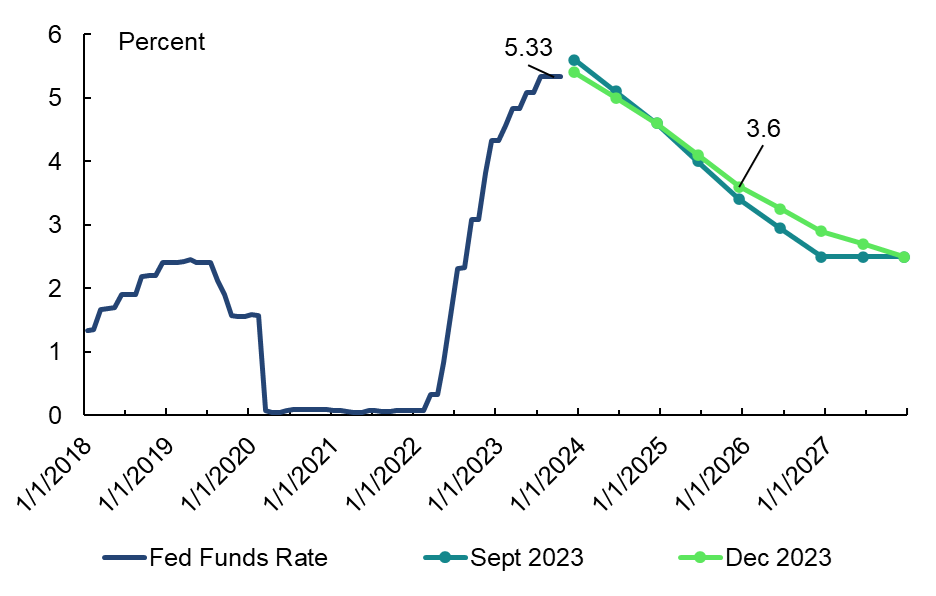
The only real differences are that the Peak rate is about 30 basis points lower than it was in September, and the descent to 2.5 percent in a few years is a tad slower.
2.5 is the rate the Fed believes to be the neutral rate[3]; with inflation behaving itself and no need for stimulus (no recession), that’s where they’d like to keep it. A few things to remember about how this rate scheme works, (a) the Fed sets a target range of a quarter percent, (b) the actual rate is given by a daily average, (c) the current target range is 5.25 to 5.5, and (d) the actual daily average has hovered at and around 5.33 for several months. The Fed’s projections are for the midpoint of the target range, so if the projected rate is 2.9, the “target range” at that time would be 2.75 to 3.
Green – September projection
Purple – December projection
Interest Rate Futures
The futures market is a different story. Last month I mentioned that the turning point in the market for interest rate futures coincided with bad things happening in China’s money market. Oil futures prices, as it turned out, did the same thing. The “outlook” as given by interest rate futures is about ¾ percent lower overall than it was in November. In the world of rates, that’s a giant move.
Blue – August 2023
Green – November 2023
Purple – December 2023
Chart C: Futures Market “Expectations” for fed funds rate, given by futures contract prices, in August, November and December
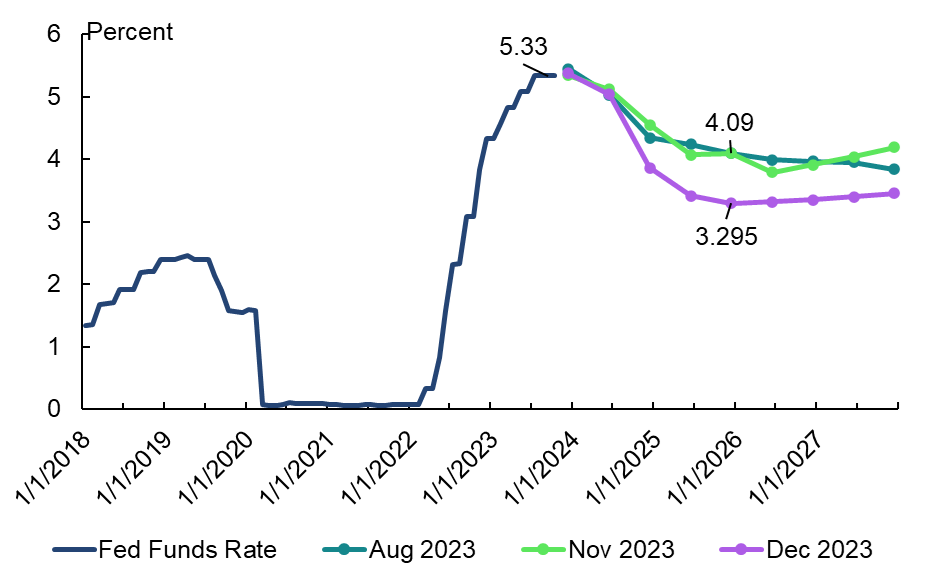
While the FOMC expects rates to remain above 4 percent at the end of 2024, the Futures market “expects” 3.86 by that time and 3.29 by the end of 2025. We can see how the market pricing was virtually unchanged from August to November, but has shifted dramatically since then.
The Fed is telling the world that they intend to bring rates back down to what they believe to be the “neutral rate” at an orderly pace. The linear path back to 2.5 in chart 1 is their way of saying, “We’ve successfully beat inflation with only tiny increases in unemployment, now we will gradually bring rates down”.
Interest rate futures tell a different story. In the Futures market, there are so many traders looking to buy protection against unexpected rate cuts that the prices of the 2024 contracts continue to get pushed down. The end of 2024 price of 3.86 percent implies that the fed will cut 1 ½ percent. In the century that the Fed has used interest rates for its monetary policy, there’s never been a cut of 1 ½ percent that wasn’t during or just before a recession. On the other hand, the market doesn’t see the rate reaching the Fed’s “neutral” level for the foreseeable future. At the risk of creating too much of a narrative out of a price, we interpret this to mean that the futures market doesn’t see the long run inflation average returning to the Fed’s target of 2 percent.
The rate cuts that have been priced in by the futures markets are steep, but historically, the futures markets have tended to underestimate both rate cuts and rate hikes. This is part of the reason my outlook is for substantially steeper cuts.
U.S. Economy
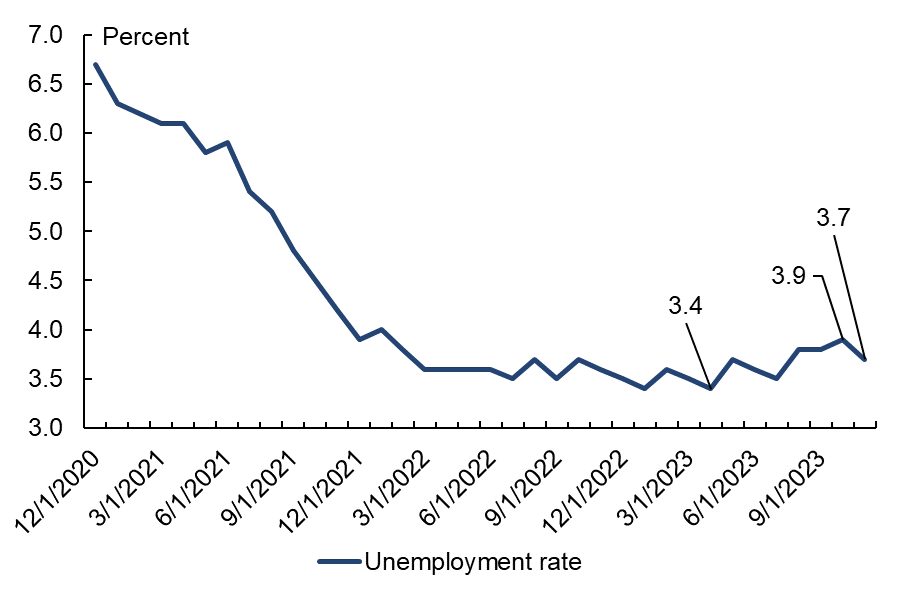
Both unemployment and inflation are widely considered to be lagging indicators, or coincident at best. All recessions bring a steep drop in the inflation rate and an increase in the unemployment rate. To see both at the same time doesn’t mean you’re headed for a recession, it means you’re in one.
In November we looked at anecdotes from the business sector showing that seasonal hiring for the 2023 holiday season has been weak. On December 13th, a consulting firm reported that seasonal hiring in October and November was the slowest since 2019[4]. In a still-growing economy the figures would be slightly higher each year.
The “hard data” from the US Department of Labor now shows an underlying trend towards increasing job losses. The “Sahm Rule” is an indicator that says a half percent increase in the unemployment rate, off of the previous 12 month low, means a recession is either in progress or about to be. The unemployment rate hit a low of 3.4 percent in April and has been higher every month since. In October, it was half a percent higher than the low, at 3.9 percent. The November print was 3.7, so it is possible that this would be the first time the Sahm Rule throws a false flag… but it would be the first time in seven decades.
Chart D: Headline Unemployment Rate (note axis minimum is 3 to better show change)
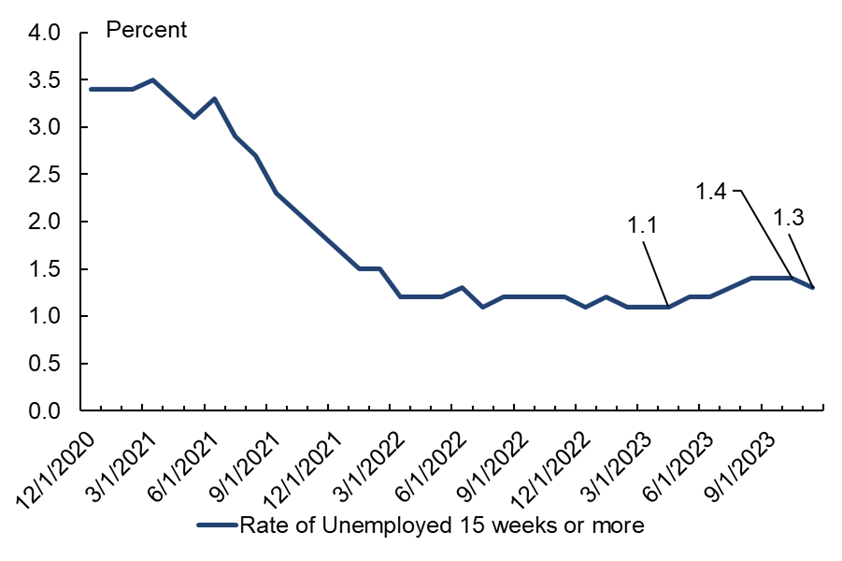
The “U-1” unemployment rate tracks only workers who’ve been out of a job for 15 weeks or more, and that rate has also risen gradually since April as well.
Chart E: U-1 unemployment rate (number unemployed 15 weeks or more as percent of workforce
The headline inflation rate has fallen by about 6 percent in the span of a year, peaking at 9 percent in June 2022 and hitting 3.1 percent in June 2023. That’s no consolation to you or me, as a fall in the inflation rate doesn’t mean prices actually go back down. But in the economic scheme of things, it’s huge. The inflation rate has never fallen by more than 3 percent in a year without a recession having been in progress or on the way.
Finally, the index of leading indicators, a widely followed stat from the Conference Board, has hovered around a low not seen since Spring 2020 for several months.
Chart F: Blue Line is the year over year change in the index of leading indicators, gray line is the year over year change in GDP
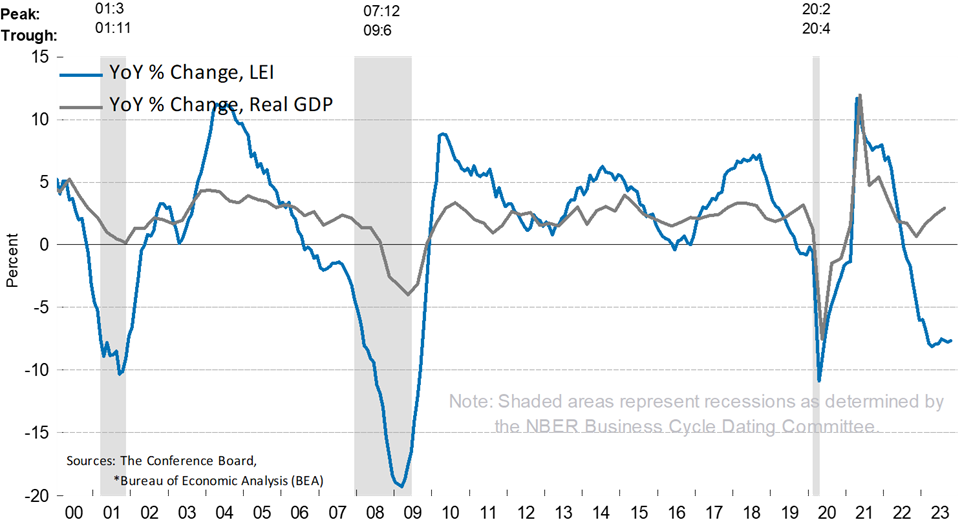
The Conference Board, November 2023
U.S. Money Markets
As I mentioned last month, the one thing that will get the central bank to deviate from any rate path is a major malfunction in the Money Market[5]. Major malfunctions have, in the past, been preceded by smaller changes in the vital signs, such as what we’ve seen in the last few weeks and months. “Since March 2020” might be a sort of “theme” for recent issues in the American and Chinese money markets.
December will be the ninth consecutive month in which it’s been more expensive to borrow in the repo market than it is to borrow in the Fed Funds market[6]. This is a measure of how easy it is for money to get from where it is to where it needs to be, and in good times, it is below zero. On November 30th we saw this indicator spike to 14 basis points[7], which until June had not happened since March 2020.
Chart G: Daily average repo rate minus daily average Fed Funds rate

The Chinese Bank ICBC is a small player in the US government bond market, with only $24 billion in assets. But when it was hacked in mid-November, it forced the Fed and the Bank of New York to keep their securities transfer services open past close. They did this so that ICBC could post the collateral it owed for its short-term borrowing[8]. Bank of New York is at the center of over $3 trillion of money market transactions a day and has assets on its own book of $405 billion. Their preference for keeping their facility open, rather than floating a customer $9 billion and collecting a fat overdraft fee plus penalty interest, is indicative of how fragile the system really is.
This event also serves as evidence of linkages between the money markets of China and the U.S. We won’t completely understand these linkages until after research and investigation by the people with the data. Unfortunately, most of those people work for the New York Fed, which seldom researches a piece of the financial system until after that piece has brought the system to its knees.
The incident also shows just how much broker-dealers like ICBC depend on overnight money to keep the bond market going. These are the facilitators of corporate and government borrowing. They’re like the wholesale beer distributor that keeps the beer cold in a warehouse until it’s needed in a grocery store.
ICBC’s entire book is $24 billion, and they owed $9 billion of collateral to Bank of New York for their borrowings in repo. If that day’s activities are representative of the norm, they’re financing at least 38 percent of their assets with the type of funding that is most susceptible to unexpected systemic shocks. A March 2020 or August 2007 event would wreck them without Fed intervention. Arrangements like these are why the Fed can’t allow the money market to malfunction for more than five seconds. The system is fragile.
The China Crisis
China has not been front page news for several weeks, but the real estate crisis continues to take its toll. Evergrande – the country’s biggest developer and poster child for the crisis – has had its liquidation delayed by a month (January 2024). The company offered its creditors certificates (IOUs) promising payments on its bonds after it can sell its assets. A move like that echoes the Clearinghouse Loan Certificates, issued to investors in lieu of gold, in the Panic of 1907. Creditors rejected that idea and (rightfully) believe they’ll get more in liquidation[9]. The company’s failure is all but certain. China’s net Foreign Direct Investment flows are negative for the first time since at least 2000, when that data was first published. On net, foreign investors pulled $12 billion out of China from July to September 2023[10].
It seems they’re reevaluating the solvency of China’s Economy, which the Wall Street Journal reported to have an estimated $7 to $11 trillion in “hidden” debts – 62 percent of its GDP at the high end. Such debts have been racked up over the last decade by what are known as “local government financing vehicles”. The same way Evergrande poured borrowed money into building residences no one could buy, the LGFVs funding infrastructure projects with returns too small to pay interest on the debt.
In the U.S., this would be like if the Federal Home Loan Banks borrowed $14 trillion from the public and then spent it on highways, bridges, and light rails to nowhere.
By mid-November, the People’s Bank of China had been lending more to the banking system than it had since 2020, now, it seems to have beat the 2020 volumes and has lent the most since 2016. At the end of November, it was reported that they might begin larger scale operations similar to the Fed’s Quantitative Easing[11]. The arrangement would look a lot like the way the Fed helped pay for World War I. The PBOC would extend loans to banks and shadow banks, specifically accepting loans on real estate as collateral. That would allow the banks and shadow banks to then lend to the real estate sector with something of a guarantee from the central bank. So far there have been no updates on that front. As if to admit the country is in recession, without actually declaring one, the central government has announced new rounds of stimulus, via deficit spending, and is pushing local governments to do the same[12]. China’s economic problems will be a drag on the companies in the US, Europe, and Asia which export trillions of dollars of inputs to the world’s factory every year.
[1] See Appendix for a summary of the rates the Fed controls
[2] Timiraos, Nick. “Fed Begins Pivot…”, The Wall Street Journal. Dec 13th, 2023.
[3] See Appendix for Explanation
[4] Wilson, Marianne. “Hiring Update…”, Chain Store Age. Dec 2023.
[5] See Appendix for details
[6] See Appendix for details
[7] One basis point is one hundredth of a percent (.01% or .0001)
[8] Bansal, Paritosh. “Inside Wall Street’s Scramble…”, Reuters. Nov 17th, 2023.
[9] Feng, Rebecca. “Evergrande Avoids Debt Disaster…”, The Wall Street Journal. Dec 4, 2023.
[10] Singh, Hardika. “China Sees No Love…”, The Wall Street Journal. Dec 8, 2023.
[11] “Chinese Style Quantitative Easing…”, Bloomberg, November 28, 2023.
[12] China’s C. Bank set to Boost Liquidity…”, Reuters. Dec 4, 2023